
The Bollinger Bands strategy is a technical analysis tool that helps traders identify trading opportunities by measuring the volatility of a financial instrument. Developed by John Bollinger in the 1980s, Bollinger Bands consist of three lines: an upper band, a lower band, and a middle band (moving average).
Bollinger Bands strategy, with its upper and lower bands, identifies overbought and oversold conditions. Forex candlestick patterns, such as the bearish engulfing , can further refine these signals.
By combining Bollinger Bands strategy with candlestick patterns, traders can gain a more comprehensive understanding of market conditions and make more informed trading decisions.

The Bollinger Bands strategy is based on the assumption that prices tend to fluctuate within a predictable range. When prices move outside of this range, it can indicate a potential trading opportunity.
Traders use Bollinger Bands to identify potential buy and sell signals, as well as to measure market volatility.
Bollinger Bands Strategy Overview
The Bollinger Bands strategy is a technical analysis tool that uses a statistical measure of price volatility to identify potential trading opportunities. It is based on the Bollinger Bands indicator, which consists of three lines:
- Upper band: A moving average of the closing prices over a specified period, plus a multiple of the standard deviation.
- Middle band: A moving average of the closing prices over a specified period.
- Lower band: A moving average of the closing prices over a specified period, minus a multiple of the standard deviation.
The Bollinger Bands strategy is based on the assumption that price tends to fluctuate within a range defined by the upper and lower bands. When price moves outside of this range, it is considered to be overbought or oversold, and a trading opportunity may exist.
Bollinger Bands Parameters
The Bollinger Bands indicator is customizable, with three main parameters:
- Period: The number of periods (typically days or candlesticks) used to calculate the moving average.
- Deviations: The number of standard deviations to use for the upper and lower bands. A higher number of deviations will result in wider bands.
- Moving average type: The type of moving average to use. Common choices include the simple moving average (SMA), exponential moving average (EMA), and weighted moving average (WMA).
The Bollinger Band width is calculated as the difference between the upper and lower bands, and the Bollinger Band percentage is calculated as the percentage of the Bollinger Band width that price is above or below the middle band.
Bollinger Bands strategy is a versatile tool that can be used to identify trading opportunities in a variety of markets, including Forex volatility trading.
By using Bollinger Bands to identify periods of high and low volatility, traders can develop strategies that capitalize on market movements and maximize their profits.
Bollinger Bands Trading Signals
The Bollinger Bands strategy generates buy and sell signals based on the position of price relative to the Bollinger Bands.
Buy Signals
- Price breaks above the upper band: This indicates that price is overbought and may be due for a correction.
- Bollinger Band squeeze: This occurs when the Bollinger Bands narrow, indicating a period of low volatility. A subsequent breakout above the upper band can be a strong buy signal.
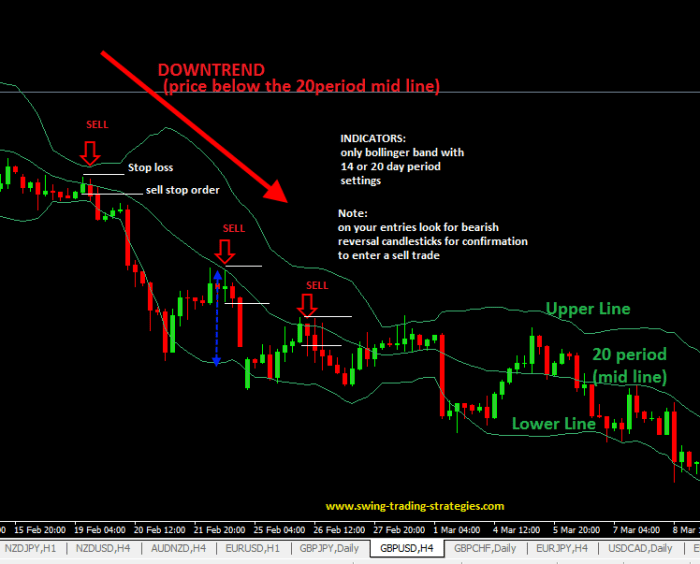
Sell Signals
- Price breaks below the lower band: This indicates that price is oversold and may be due for a correction.
- Bollinger Band squeeze: This occurs when the Bollinger Bands narrow, indicating a period of low volatility. A subsequent breakout below the lower band can be a strong sell signal.
Bollinger Bands Customization
The Bollinger Bands strategy can be customized to suit different markets and time frames.
- Period: The period should be adjusted to match the time frame of the chart. For example, a daily chart would use a period of 20 or 50 days, while an hourly chart would use a period of 10 or 20 hours.
- Deviations: The number of deviations should be adjusted to the volatility of the market. A more volatile market will require a higher number of deviations.
- Moving average type: The moving average type can be adjusted to suit the trader’s preferences. The EMA is a more responsive moving average than the SMA, while the WMA gives more weight to recent prices.
Bollinger Bands Limitations and Considerations
The Bollinger Bands strategy is a useful tool for identifying potential trading opportunities, but it has some limitations and considerations:
- Lagging indicator: The Bollinger Bands indicator is a lagging indicator, which means that it reacts to price changes after they have occurred.
- False signals: The Bollinger Bands strategy can generate false signals, especially in volatile markets.
- Not suitable for all markets: The Bollinger Bands strategy is best suited for markets with a clear trend.
To mitigate these limitations, traders should use the Bollinger Bands strategy in conjunction with other technical indicators and consider using a confirmation signal before entering a trade.
Bollinger Bands Case Studies, Bollinger Bands strategy

There are numerous examples of successful Bollinger Bands trading strategies. One example is the Bollinger Band squeeze strategy, which involves trading the breakouts of Bollinger Band squeezes.
Another example is the Bollinger Band percentage strategy, which involves trading the percentage of the Bollinger Band width that price is above or below the middle band.
The Bollinger Bands strategy can be used to trade a variety of markets, including stocks, commodities, and currencies. It is a versatile strategy that can be customized to suit different traders and markets.
Last Point: Bollinger Bands Strategy
The Bollinger Bands strategy is a versatile tool that can be used by traders of all levels of experience. It is a powerful tool that can help traders identify trading opportunities and make more informed trading decisions.
FAQ Summary
What are Bollinger Bands?
Bollinger Bands are a technical analysis tool that helps traders identify trading opportunities by measuring the volatility of a financial instrument.
How do Bollinger Bands work?
Bollinger Bands consist of three lines: an upper band, a lower band, and a middle band (moving average). The upper and lower bands are set a certain number of standard deviations away from the middle band. When prices move outside of this range, it can indicate a potential trading opportunity.
What are the benefits of using Bollinger Bands?
The Bollinger Bands strategy is a popular technical analysis tool that uses Bollinger Bands to identify potential trading opportunities.
Bollinger Bands are a type of Forex technical indicators that measure the volatility of a currency pair. The Bollinger Bands strategy can be used to identify trend reversals, breakouts, and overbought or oversold conditions.
Bollinger Bands can help traders identify trading opportunities, measure market volatility, and make more informed trading decisions.

